- Homepage
- Key Information
- Students
- Staff
- PGR
- Health and Safety
- Computer Support
- National Student Survey (NSS)
- Intranet Help
Dr Georgios Efstathiou
Research
Modelling the Boundary-Layer Grey Zone:
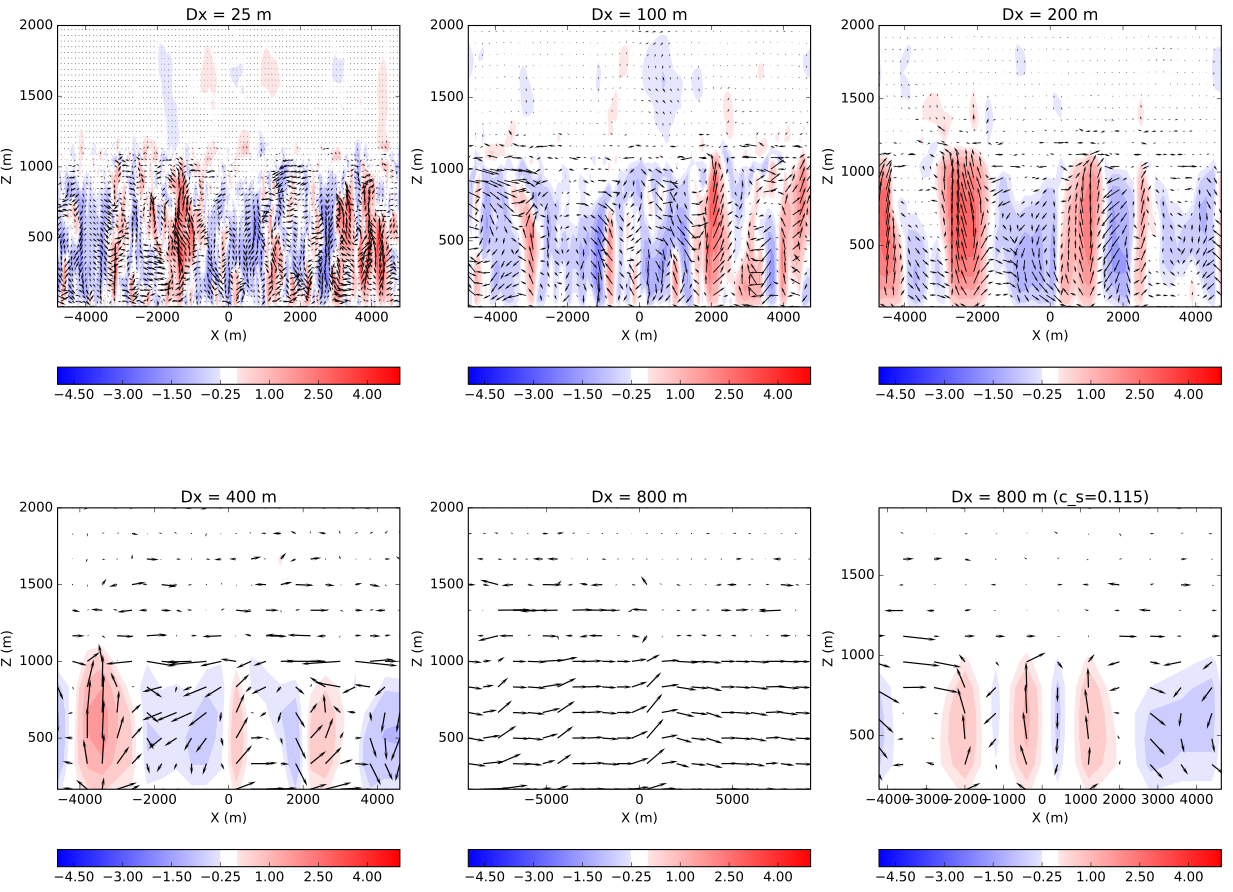
The recent significant increase of computer power means that NWP models are now able to operate at sub-kilometre horizontal resolutions. For the convective boundary layer this leads to partially-resolved convective structures (thermals). At these resolutions the dominant turbulence length scales become comparable to the grid spacing and directly affected by the effective dissipation. The lack of a clear seperation of scales means that neither RANS nor LES approaches are appropriate for the modelling of sub-grid turbulent transfer. Therefore, NWP is now entering the "Terra Incognita" or the boundary layer "grey zone", where little is known about how the boundary layer and turbulent motions in general, should be represented in high-resolution atmospheric models.

Panel plot on the left: Vertical cross sections of vertical velocity taken from numerical simulations of a CBL at different horizontal resolutions, starting from the the LES limit (Δx = 25m). Bottom-right and bottom-middle figures show the impact of a reduced sub-grid mixing length at resolved motions in the grey zone (Δx = 800m).
I gave an invited talk on dynamic sub-grid modelling of the evolving convective boundary layer, at the ECMWF "Shedding light on the greyzone workshop" on November 2017. (See a video recording of the talk.)
Dynamic sub-grid modelling of moist convection
Turbulence length-scales can be affected by the physical characterisitics of the flow. Different flow regimes exist where the dominant length scales might differ, such as the evolving boundary layer and the cloud layer, Therefore, sub-grid mixing length scales should adapt to the flow field and the resolved turbulence structures. Dynamic modelling determines the sub-grid mixing lengths by using the resolved scales, which makes dynamic approaches suitable for regions where there is no clear scale seperation.

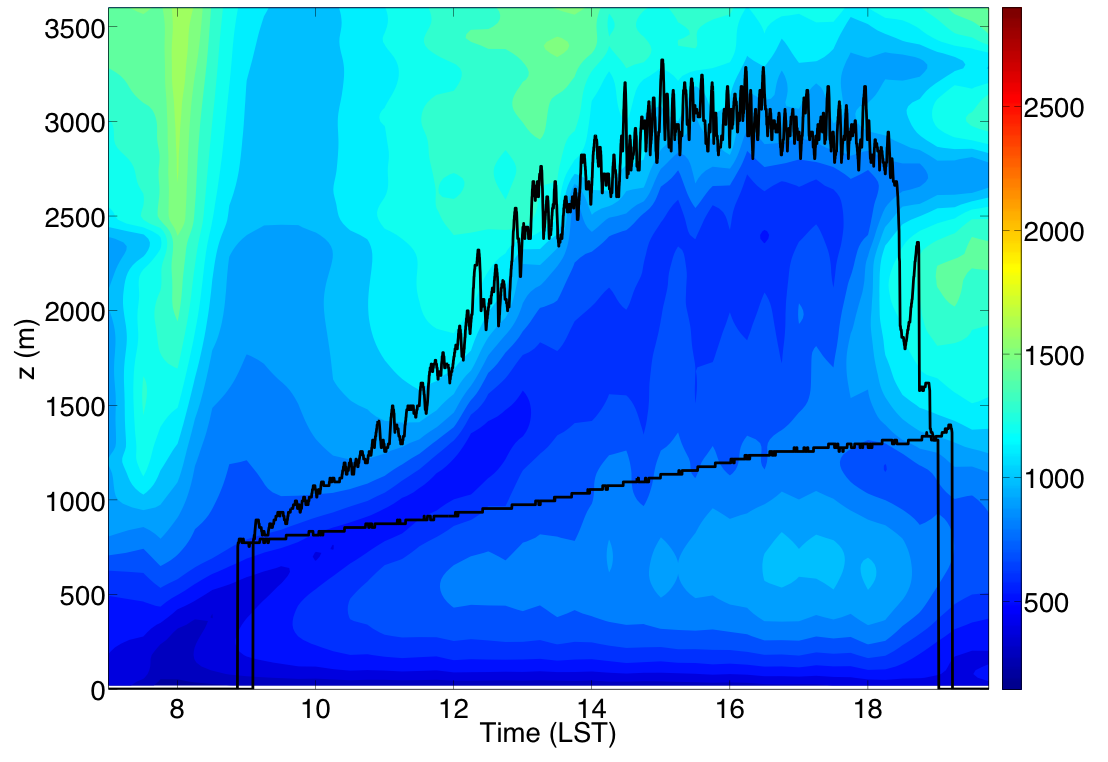
Plot above: Dominant length scales (filled contours in m) of vertical velocity spectra during the ARM shallow cumulus case study, as simulated by the Met Office LEM. Black lines denote BL and cloud layer extent.
Identifying coherent structures in the Boundary Layer - Shallow Cu
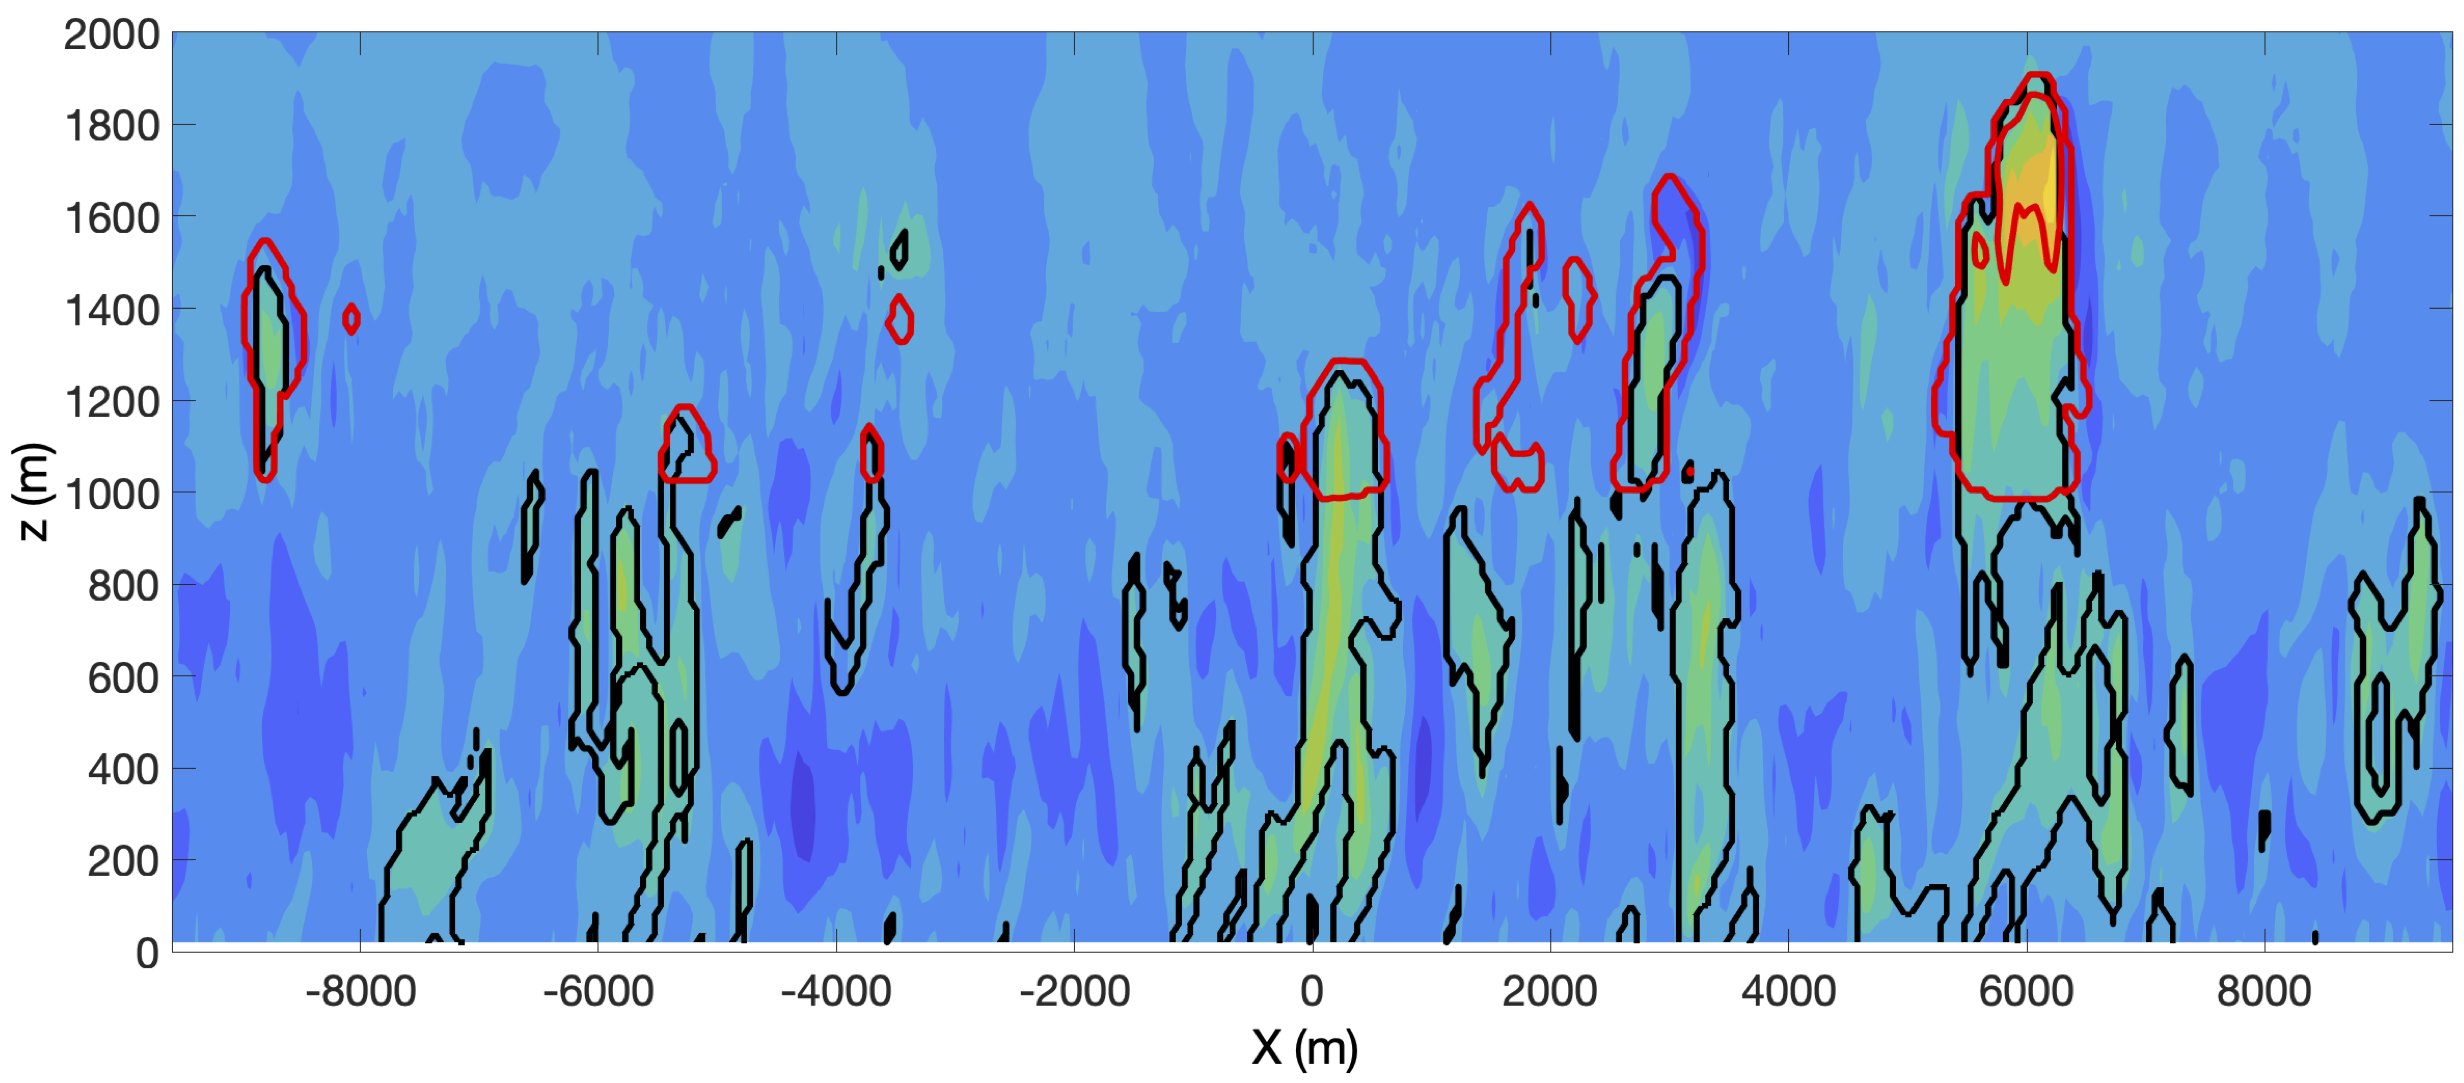
How can we partition BL flow into coherent (thermals/non-local) and small-scale (local) motions? The continuous flow of energy from the turbulence energy-production to the dissipation scales makes this distinction difficult. Many parametrization approaches require this information beforehand. I am working towards a method to partition the flow based on optimizing the turbulent vertical scalar flux in a two-fluid representation of the BL.

Plot above: Vertical cross-section of vertical velocities from a Large-Eddy Simulation of the ARM shallow cumulus case study with the Met Office LEM. Bold black lines identify the extend of coherent structures according to the new optimization methodology. Red lines represent the edges of cloud structures.
See a paper published in Boundary-Layer Meteorology and a presentation I gave at the Convection Parametrization: Progress and Challenges workshop, held at the UK Met Office on July 2019.
